


 Protectapet
 Lola Designs
 Saint and Sofia
 PD Adventure Sports
 Atlas Flowers
 Philip Oakley

Power BI is a powerful tool for creating and sharing interactive data visualizations. But how can you share your Power BI reports with others, especially if they don't have access to the Power BI service or desktop app? In this blog post, we will list all the ways you can share a Power BI report, along with their pros and cons.
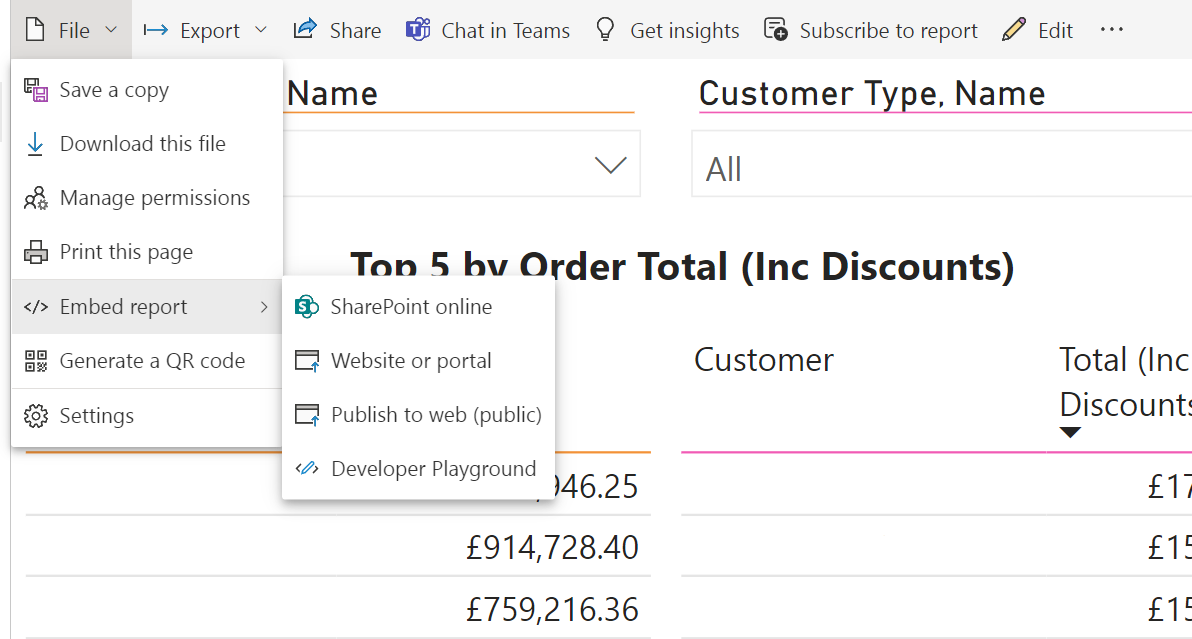
1. Publish to web
This is the easiest and most widely available option for sharing a Power BI report. You can simply generate an embed code from the Power BI service and paste it into any web page, such as a blog post, a website, or a social media platform. The embed code will display your report as an iframe, which means it will be interactive and responsive to different screen sizes. Anyone with the link can view your report, without needing a Power BI account or license.
However, this option also has some limitations and risks. First of all, you cannot control who can access your report, as it is publicly available on the web. This means you should not use this option for sensitive or confidential data. Secondly, you cannot apply any security or filtering to your report, as it will show the same data to everyone. Thirdly, you cannot refresh your data automatically, as the embed code will use a snapshot of your report at the time of publishing. You will need to manually republish your report every time you want to update the data.
2. Share a dashboard
Another option for sharing a Power BI report is to share a dashboard that contains your report as a tile. You can do this from the Power BI service, by clicking on the Share button on the top right corner of your dashboard. You can then enter the email addresses of the people you want to share with, and optionally add a message and adjust some settings. The recipients will receive an email invitation to view your dashboard, and they will need to sign in with their Power BI account or create one if they don't have one.
This option allows you to share your report with specific people, and apply some security and filtering options. For example, you can choose whether to allow recipients to reshare your dashboard, export data from it, or build new content based on it. You can also use row-level security (RLS) to restrict the data that different users can see in your report. Additionally, you can refresh your data automatically or on demand, as the dashboard will reflect the latest data from your dataset.
However, this option also has some drawbacks. First of all, you can only share your report with people within your organization or with external users who have a Power BI Pro license. This means you cannot share your report with anyone who does not have a Power BI account or license. Secondly, you cannot share your report as a standalone item, but only as part of a dashboard. This means you may need to create a new dashboard or modify an existing one to include your report as a tile. Thirdly, you cannot customize the appearance or interactivity of your report in the dashboard, as it will inherit the settings from the original report.
3. Export to PDF or PowerPoint
A third option for sharing a Power BI report is to export it to a PDF or PowerPoint file. You can do this from the Power BI service or desktop app, by clicking on the Export button on the top right corner of your report. You can then choose whether to export the entire report or only the current page, and adjust some settings such as page size and layout. The export process will generate a file that contains static images of your report pages, along with some metadata and hyperlinks.
This option allows you to share your report with anyone who can open a PDF or PowerPoint file, without needing a Power BI account or license. You can also print your report or present it offline using this option. Additionally, you can edit or annotate your report in the PDF or PowerPoint file, using any tools that are compatible with these formats.
However, this option also has some limitations. First of all, you lose the interactivity and responsiveness of your report, as it is converted into static images. This means you cannot drill down, filter, slice, or zoom in on your data in the exported file. Secondly, you cannot refresh your data automatically or on demand, as the exported file will use a snapshot of your report at the time of exporting. You will need to manually re-export your report every time you want to update the data.
.png?width=1204&height=595&name=image%20(1).png)
.png?width=2079&height=1286&name=image%20(2).png)
4. Embed in SharePoint Online or 5. Microsoft Teams
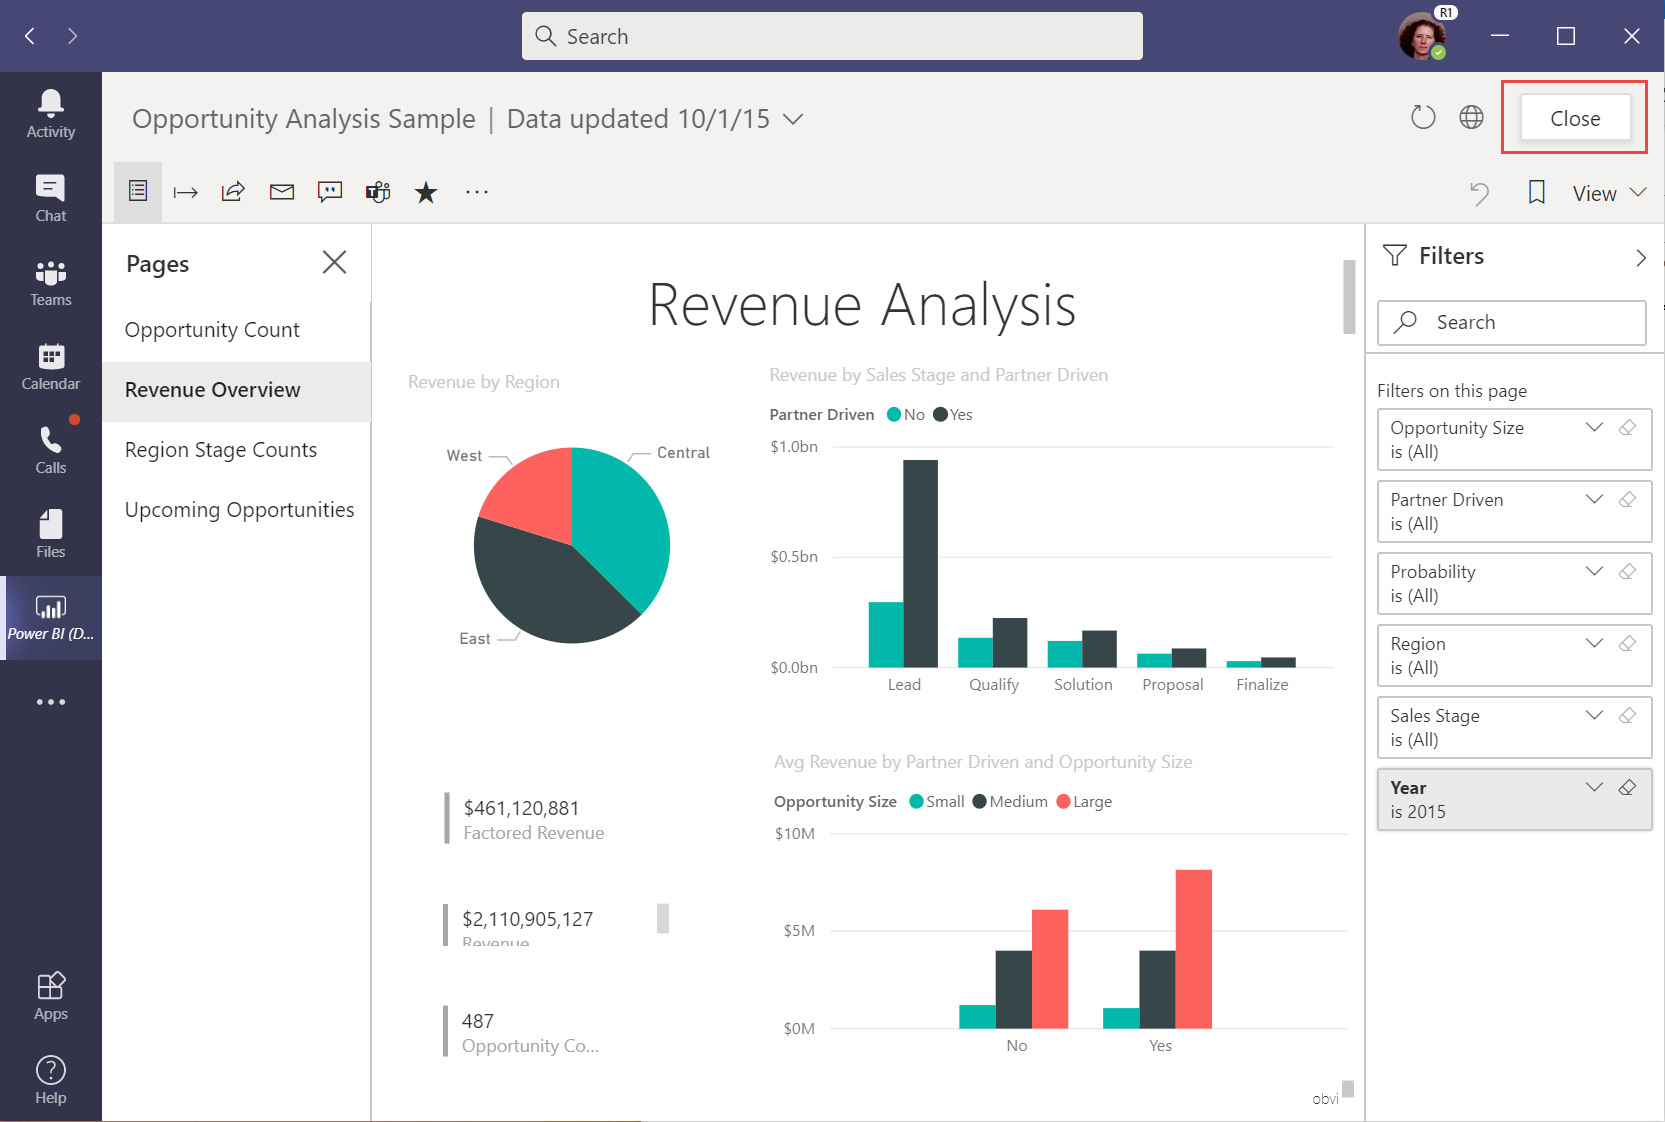
A fourth and fifth option for sharing a Power BI report is to embed it in SharePoint Online or Microsoft Teams. You can do this from the Power BI service, by clicking on the Embed button on the top right corner of your report. You can then choose whether to embed your report in SharePoint Online or Microsoft Teams, and copy the embed code or link that is generated. You can then paste the embed code or link into any SharePoint Online page or Microsoft Teams tab that supports embedding web content.
This option allows you to share your report with people who have access to your SharePoint Online site or Microsoft Teams channel, and apply some security and filtering options. For example, you can use SharePoint Online or Microsoft Teams permissions to control who can view your report, and use row-level security (RLS) to restrict the data that different users can see in your report. Additionally, you can refresh your data automatically or on demand, as the embedded report will reflect the latest data from your dataset.
However, this option also has some requirements and constraints. First of all, you need to have a Power BI Pro license and a SharePoint Online or Microsoft Teams license to use this option. You also need to have permission to edit the SharePoint Online page or Microsoft Teams tab where you want to embed your report. Secondly, you can only embed your report as an iframe, which means it may not fit well with the layout or design of your SharePoint Online page or Microsoft Teams tab. Thirdly, you cannot customize the appearance or interactivity of your report in the embedded iframe, as it will inherit the settings from the original report.
Conclusion
As you can see, there are many ways to share a Power BI report, each with its own advantages and disadvantages. Depending on your audience, purpose, and data sensitivity, you may choose one or more of these options to share your insights and findings with others. We hope this blog post has helped you understand the different options and how to use them effectively.